
Power BI Journey: Blog #5


In this lesson, the topic discussed was regarding drill-downs. I can compare it to a "Prezi" equivalent in Power BI. In Prezi, we can zoom in and out of a powerpoint presentation to see details encapsulated in a mother topic.

In drill downs, we are shown a summarized graph of the data but if we want to know some of the nitty-gritty stuff within that graph, we can "drill down" further to see the specifics within that summary.

As an example, we have the following summarized visualization for the Price by Product and Store.


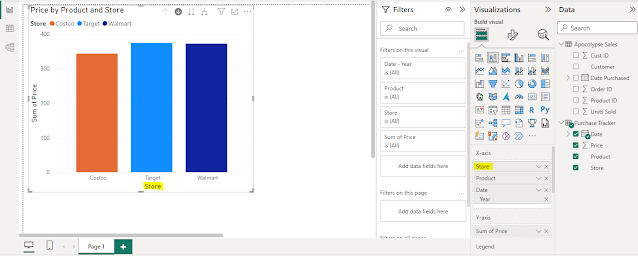
If we activate the drill-down icon and click one of the bars i.e. Costco, we will be able to see the total price of the products that were bought at Costco as shown below.


We can further drill down on specific quarters to see how the product sold in those quarters. In this case, more purchases of bottled water were recorded during the first quarter.


Note: Drill-downs are specifically useful when conducting presentations and stakeholders want to know specific details regarding the visualization that is being presented.


Comments

Popular posts from this blog

Privacy Policy of ShinStats: descriptives calc

Privacy Policy Shin Nix built the ShinStats app as an Ad Supported app. This SERVICE is provided by Shin Nix at no cost and is intended for use as is. This page is used to inform visitors regarding my policies with the collection, use, and disclosure of Personal Information if anyone decided to use my Service. If you choose to use my Service, then you agree to the collection and use of information in relation to this policy. The Personal Information that I collect is used for providing and improving the Service. I will not use or share your information with anyone except as described in this Privacy Policy. The terms used in this Privacy Policy have the same meanings as in our Terms and Conditions, which are accessible at ShinStats unless otherwise defined in this Privacy Policy. Information Collection and Use For a better experience, while using our Service, I may require you to provide us with certain personally identifiable information. The information that I request will be retaine...

Power BI Journey: Blog #6

In this lesson, the focus is on "Conditional Formatting" which is very much similar to the conditional formatting in MS Excel which I could relate to following the making of the joint reporting system for personnel during my second job. Basically, we click the data columns that we want to be displayed in a tabular visualization.  Next, we select the columns that we will be applying conditional formatting to > Right-click on that column > Select Conditional Formatting > Select from among the options which is more appropriate for your application In this particular exercise, we utilized Background conditional formatting using gradient (applied on the first column of the first table) and rules (IF ELSE which was applied on the second column of the first table), Icons conditional formatting (applied on the second column of the first table), Data bars conditional formatting (applied on the second column of the first table and the fourth column of the second table). In the...

SQL Journey: Blog #3

I have reached the end of lesson 2. The final project is entitled "Data dig" where we are given a set of interesting  data sets: NASA astronauts , Superbowl results , Pokemon stats , NBA players , Top movies , Top countries by population , Solar system objects by size , Marvel characters , Furniture store sales , Earned KA badges , Winston's donut logs , Card game results , and NFL draft picks . We are to pick one of those data sets and use advanced SELECT queries to discover things about the data. What sort of questions might one have about that data, like if they were using it for an app or a business idea? Here are some ideas:What are average, max, and min values in the data? What about those numbers per category in the data (using HAVING)? What ways are there to group the data values that don’t exist yet (using CASE)? What interesting ways are there to filter the data (using AND/OR)? Basically, the above given questions will serve as a guide on what we could dig from ...