
My Python Journey: Blog #1

It has been a while since my last blog entry. Today, I want to document my thought process on how I created a Python program that would generate a step-by-step solution to Statistics worded problems.


It started with a why: "Why should I automate the writing of solutions to Statistics problems?" My first reason was that I encounter certain problems in the tutoring platform that are frequently recurring. Only the givens in the problem changes but the steps are all the same. This means that every time I encounter these problems, I have to re-type the procedure with all the LaTeX formatting involved in certain formulas. And, that is somewhat frustrating. Time is gold has never been this real to me. And the time I spend on one problem means a delay in solving other problems. The delay means decreased revenue on my part since I can solve only a limited number of problems within a day. 

Because of this frustration, I thought of an idea. "What if I create an MS Excel or Word Document template that I will just copy and paste and then input the associated given in the problem?" This way I will be more efficient. I proceeded to make an MS Excel document. Here is an example of a probability calculator when given a contingency table.


While this is convenient and I will only input the given values in the contingency table for the next related problem, this is not efficient since I still have to write the step-by-step procedure and also the associated formulas. In other words, it minimized the calculation part but the problem with spending so much time writing the procedure on how to solve the problem was still there.


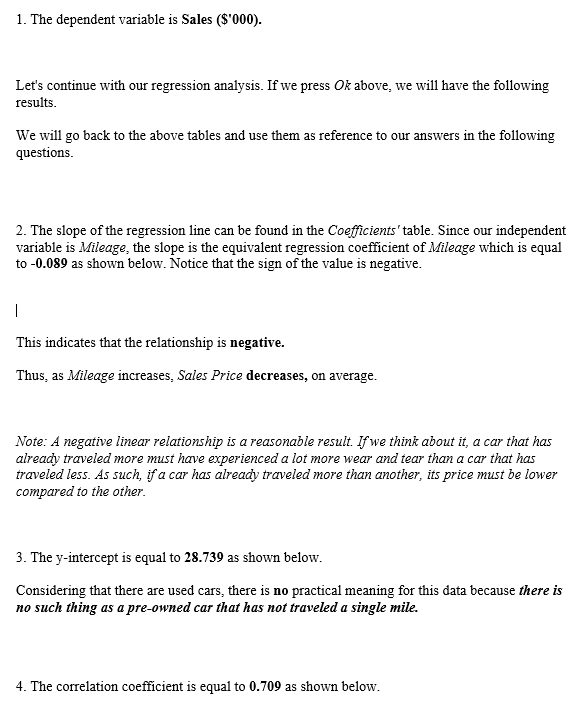
What I did next is to create a template so that writing the procedure would be minimized, and all I need to do is insert the associated tables/pictures within the procedure. Here is an example of the template for linear regression analysis.


The next challenge for me was to make the template adaptive. What I mean by this is, whenever a related problem comes along how fast can the template generate the step-by-step solutions for me. Currently, it was not so fast. At least, not in the way I intended it to be. There are still times when I struggle to use the template which makes it a little non-user friendly. I am the one who made the template so how much more if I teach this template to others. If I am struggling, it follows that they will also struggle. There are still a significant number of manual inputs involved.


There's no other way. I have to muster the courage to journey into the unknown. I have to learn how to code. I have already encountered this on Youtube before but I just let it slide since I don't have much use to it back then. I mean my job does not involve programming so there is no urgent need to learn it. But it did give me a spark for the possibility of learning something new.


And so, I dedicated minutes and hours each day trying to learn this. I remember spending at least a minimum of 20 minutes every day. 20 minutes trying to understand the theory of the lesson and applying the knowledge I learned on some practical exercises on the video. 20 minutes since sometimes I get drained by the information that was presented to me. And each day, for 20 minutes or more, the possibility and opportunity became more and more evident. I can do this!

Comments

Popular posts from this blog

Privacy Policy of ShinStats: descriptives calc

Privacy Policy Shin Nix built the ShinStats app as an Ad Supported app. This SERVICE is provided by Shin Nix at no cost and is intended for use as is. This page is used to inform visitors regarding my policies with the collection, use, and disclosure of Personal Information if anyone decided to use my Service. If you choose to use my Service, then you agree to the collection and use of information in relation to this policy. The Personal Information that I collect is used for providing and improving the Service. I will not use or share your information with anyone except as described in this Privacy Policy. The terms used in this Privacy Policy have the same meanings as in our Terms and Conditions, which are accessible at ShinStats unless otherwise defined in this Privacy Policy. Information Collection and Use For a better experience, while using our Service, I may require you to provide us with certain personally identifiable information. The information that I request will be retaine...

Power BI Journey: Blog #6

In this lesson, the focus is on "Conditional Formatting" which is very much similar to the conditional formatting in MS Excel which I could relate to following the making of the joint reporting system for personnel during my second job. Basically, we click the data columns that we want to be displayed in a tabular visualization.  Next, we select the columns that we will be applying conditional formatting to > Right-click on that column > Select Conditional Formatting > Select from among the options which is more appropriate for your application In this particular exercise, we utilized Background conditional formatting using gradient (applied on the first column of the first table) and rules (IF ELSE which was applied on the second column of the first table), Icons conditional formatting (applied on the second column of the first table), Data bars conditional formatting (applied on the second column of the first table and the fourth column of the second table). In the...

SQL Journey: Blog #3

I have reached the end of lesson 2. The final project is entitled "Data dig" where we are given a set of interesting  data sets: NASA astronauts , Superbowl results , Pokemon stats , NBA players , Top movies , Top countries by population , Solar system objects by size , Marvel characters , Furniture store sales , Earned KA badges , Winston's donut logs , Card game results , and NFL draft picks . We are to pick one of those data sets and use advanced SELECT queries to discover things about the data. What sort of questions might one have about that data, like if they were using it for an app or a business idea? Here are some ideas:What are average, max, and min values in the data? What about those numbers per category in the data (using HAVING)? What ways are there to group the data values that don’t exist yet (using CASE)? What interesting ways are there to filter the data (using AND/OR)? Basically, the above given questions will serve as a guide on what we could dig from ...